My previous load testing of GeoServer and MapServer involved requesting just one 256x256 pixel map across all the virtual user sessions. In this test, GeoServer performed stunningly well so long as no re-projection was involved, when it performed terribly. This test may not be realistic, because this is not how a real interactive map would load the server when under load from many users. Also, we might have hit a sweetspot where GeoServer always caches in memory the last map (or something).
To run a more realistic test I spread the virtual users across 10 different map requests in different parts of the country (i.e. on different underlying map image files).
Each test ran for 100 seconds, starting with 10 virtual users, increasing by 10 every 10 seconds. The tilecache image was of course cached and simply being retrieved from disk. All tests were using the same web server, with files on the same drive.
Note: the vertical scale differs in each graph to fit the observed values.
With re-projection into Spherical Mercator, 100 virtual users
| | GeoServer | MapServer | Tilecache |
| Transactions | 1283 | 770 | 2301 |
| Errors | 0 | 0 | 0 |
| Average response time (seconds) | 3.5 | 6.7 | 2.2 |
| 95% response time (seconds) | 15.9 | 23.6 | 8.7 |
| Response graph | 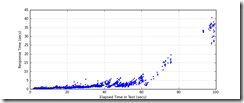 | 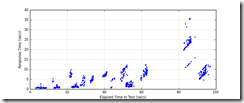 | 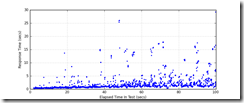 |
| Transactions per second | 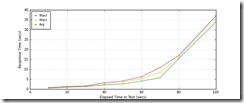 | 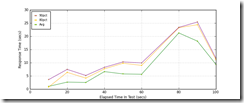 | 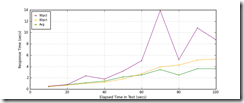 |
| Sample image |  |  | Same as MapServer (because created with MapServer) |
| Comments | Horrible image, but blistering performance until 70 users, then major outage for about 20 seconds, then resumed. | Lovely image, moderate performance; also suffered a pause in service once usage went over 60 sessions. | Reassuring performance |
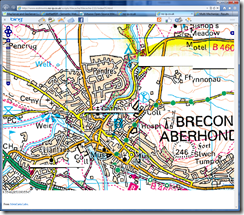
Note: sometimes GeoServer simply fails to re-project rasters correctly:
Without re-projection, 100 virtual users
| | GeoServer | MapServer | Tilecache |
| Transactions | 2476 | 554 | 2877 |
| Errors | 10 | 0 | 2 |
| Average response time (seconds) | 2.0 | 7.1 | 1.8 |
| 95% response time (seconds) | 5.6 | 18.9 | 5.6 |
| Response graph | 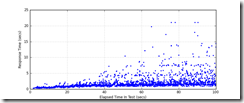 | 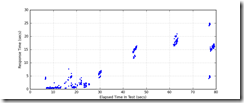 | 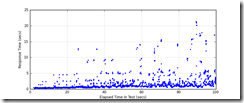 |
| Transactions per second | 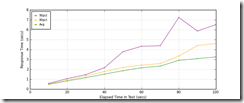 | 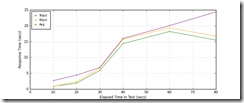 | 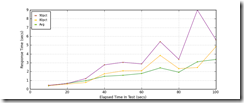 |
| Sample image |  |  | Same as MapServer (because created with MapServer) |
| Comments | Image quality the same as MapServer. A few errors crept in when the number of virtual sessions hit 100. Apart from this, remarkable performance. | Stuttering performance once loading goes beyond about 30 virtual users. No errors, but slow. | Reassuring performance, but only a whisker faster than GeoServer.
Interesting that the tilecache is faster in 27700 than in 900913 – I think this is simply because the images on disk are larger (presumably because rotated and re-sampled from the originals). |
I then ran the tests again with less extreme loading, this time only 50 virtual users ramping up over 50 seconds.
With re-projection into Spherical Mercator, 50 virtual users
| | GeoServer | MapServer | Tilecache |
| Transactions | 1033 | 491 | 1138 |
| Errors | 0 | 0 | 0 |
| Average response time (seconds) | 1.3 | 2.8 | 1.1 |
| 95% response time (seconds) | 2.7 | 10.7 | 3.5 |
| Response graph | 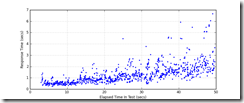 | 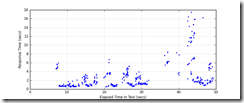 | 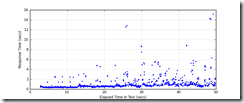 |
| Transactions per second | 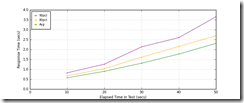 | 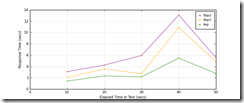 | 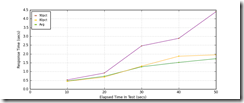 |
| Comments | Impressive performance – but we need to find a way of making the image look less horrible | Lovely image, moderate performance. | Reassuring performance, though some very slow responses for a few tiles, and the 95% figure is worse than GeoServer. |
Without re-projection, 50 virtual users
| | GeoServer | MapServer | Tilecache |
| Transactions | 1152 | 319 | 1364 |
| Errors | 0 | 0 | |
| Average response time (seconds) | 1.2 | 4.3 | 1.0 |
| 95% response time (seconds) | 2.2 | 15.2 | 2.7 |
| Response graph | 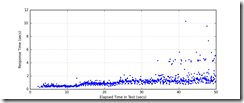 | 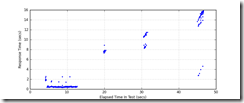 | 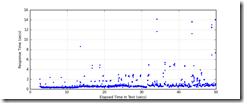 |
| Transactions per second | 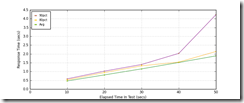 | 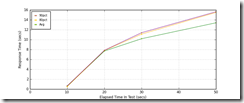 | 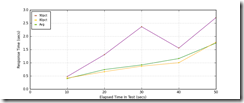 |
| Comments | Very impressive | Very unimpressive. I don’t really understand how MapServer can be slower when not re-projecting than when it is, but this is a consistent pattern. | Although the average response is faster than GeoServer, there were enough slow ones to make the overall 95% figure worse. i.e. for overall reliably fast performance, GeoServer beats a tilecache in this test. |
Conclusions
These tests were a far more realistic simulation of real-world loading than the previous single-tile test.
MapServer wins on image quality when re-projecting, but as before this probably means we have not found the way to make GeoServer re-sample nicely.
Also MapServer was the only service to sail through all tests without any errors. Unfortunately previous tests showed that it can fail on some OS raster tiles though, regardless of load.
For speed, GeoServer wins by a mile in these tests. In fact it is almost as fast as a tilecache when hit with up to around 70 concurrent virtual users. After that it start throwing errors and collapsing (so presumably needs more server power than we are giving it). But this does beg the question whether we really need to build a tilecache for rasters that are being served in their native projection – perhaps a GeoServer service would be adequate where the service is not expecting much usage.
When I have time, I’ll repeat similar tests working against various vector data sources.