Gradient and Accessibility Mapping
Contents
- Introduction
- Approach
- Data presentation
Introduction
Using height / contour data and a rights of way dataset it is possible to thematically map individual paths or links according to their average or steepest gradient. Given that path gradient is probably the most fundamental accessibility characteristic of a path, this mapping provides a fantastic resource to start looking at accessibility issues and for publishing accessibility information to the web.
Having created a gradient dataset, it becomes trivial to start adding other accessibility parameters and to thematically map the results. For instance it would be easy to show ‘level paths that are also stile free’.
Clients need to supply PROW data and surface data (height/contour).
Approach
The methodology is not as straight forward as it might seem to be and this document outlines a method for calculating the along-path gradient for a Public Rights of Way dataset.
Two input datasets are required, the linear path network, and the surface. The surface could be represented in many different digital ways, and this method describes working with a dataset of contour lines, where each polyline represents a line along which the landsurface is at equal height.
The basic approach is summarised below, although the practicalities of implementing this are less straight forward!
- Break the PROW network down into segments where the rights of way polylines intersect the contour lines
- Calculate and assign the length of each new segment
- Assign to each segment a value for the maximum and minimum height along its length
- Calculate the gradient using the along path length of each segment and the height difference
- Assign each link with maximum gradient value
Data presentation
Gradient data can be presented using the segment as the display unit or by using the path link as the display unit. The latter is more meaningful to users as a link may have only a short steep section along it, but the effect of that may make that network link unusable to someone unable to manage certain gradients.
Typically we present gradient data in 2 ways:
- Thematically mapped by gradient segment
Produces a very detailed picture of path slopes and shows the location of every change in gradient
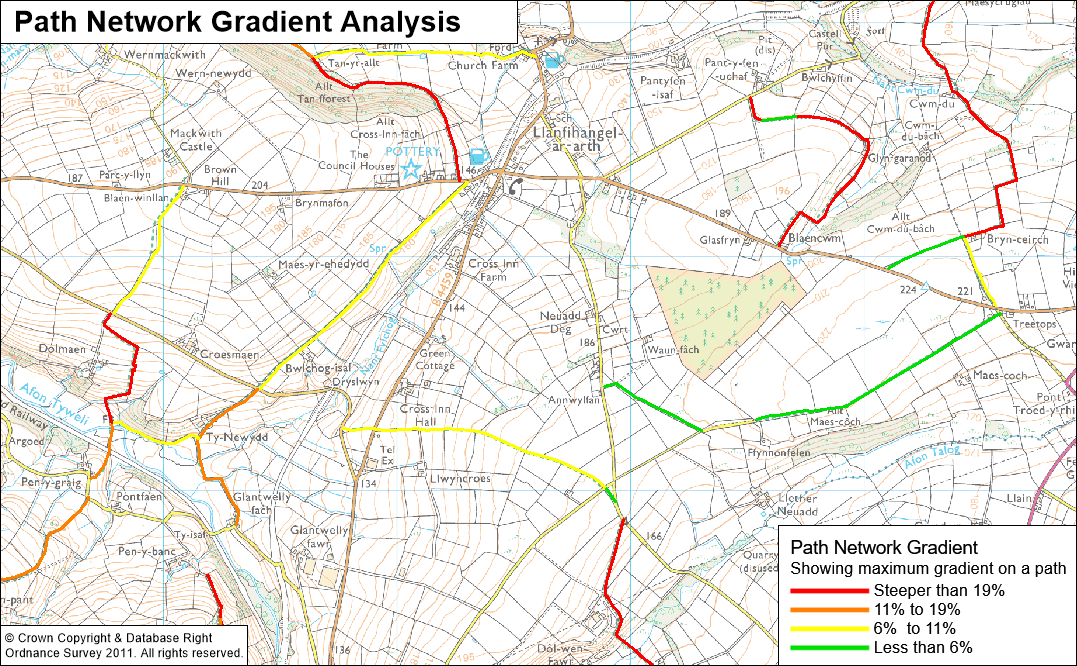
- Thematically mapped by link showing the steepest gradient
Produces a more meaningful picture of path slopes with the whole link coloured according to the steepest gradient segment along its length
There is no agreed national standard to grouping gradients across a whole path network (although there are various approaches for categorizing gradients at the shallower end of the spectrum). We have used the following approach which seems to produce useful information.