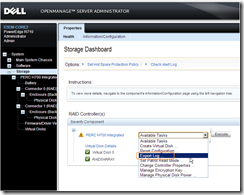
Log files can be obtained from Dells OpenManage interface – see below:

This can show up disk errors and RAID errors for disks that have yet themselves to flag themselves as failing. This can cause all sorts of IO bottlenecks etc.
Note – if the disks are not Dells – the logs will often include SENSE errors which can be ignored e.g.
T61: DM_DevConfigParamCallback: SENSE Len 12 ResponseCode 70 senseKey 5 asc 26 ascq 0
T61: DM_DevConfigParamCallback: Rdm x80500400 FAILED Pd 2 Data 84275da0 Len 10 Cdb 15 pageIndex 3
Every so often the RAID controller goes off and does a “Patrol Read” which may look something like this:
09/01/12 3:52:49: prCallback: PR completed for pd=00
09/01/12 4:08:51: EVT#06109-09/01/12 4:08:51: 94=Patrol Read progress on PD 03(e0x20/s3) is 19.99%(3971s)
09/01/12 4:09:00: EVT#06110-09/01/12 4:09:00: 94=Patrol Read progress on PD 02(e0x20/s2) is 19.99%(3964s)
09/01/12 4:09:24: EVT#06111-09/01/12 4:09:24: 94=Patrol Read progress on PD 05(e0x20/s5) is 19.99%(3980s)
.
.
09/01/12 10:15:48: EVT#06141-09/01/12 10:15:48: 94=Patrol Read progress on PD 03(e0x20/s3) is 99.99%(25220s)
09/01/12 10:15:50: prCallback: PR completed for pd=03
09/01/12 10:17:33: EVT#06142-09/01/12 10:17:33: 94=Patrol Read progress on PD 05(e0x20/s5) is 99.99%(25349s)
09/01/12 10:17:36: prCallback: PR completed for pd=05
09/01/12 10:18:34: EVT#06143-09/01/12 10:18:34: 94=Patrol Read progress on PD 02(e0x20/s2) is 99.99%(25378s)
09/01/12 10:18:37: prCallback: PR completed for pd=02
09/01/12 10:21:50: EVT#06144-09/01/12 10:21:50: 94=Patrol Read progress on PD 04(e0x20/s4) is 99.99%(25606s)
This is basically just checking disks are all in alignment etc – and is good if it completes without errors as above (though it may temporarily slow down I/O a little)
If however your log has lots of sections like this in it you have problems.
06/12/13 21:43:38: EVT#36801-06/12/13 21:43:38: 113=Unexpected sense: PD 04(e0x20/s4) Path 4433221103000000, CDB: 8f 00 00 00 00 00 c3 e9 4f 7b 00 00 10 00 00 00, Sense: 3/11/00
06/12/13 21:43:38: Raw Sense for PD 4: f0 00 03 c3 e9 4f 8e 0a 00 00 00 00 11 00 00 00 00 00
06/12/13 21:43:38: DEV_REC:Medium Error DevId[4] devHandle f RDM=807ad600 retires=0
06/12/13 21:43:38: MedErr is for: cmdId=2489, ld=1, src=0, cmd=2, lba=662bea96, cnt=20, rmwOp=0
06/12/13 21:43:38: ErrLBAOffset (13) LBA(c3e94f7b) BadLba=c3e94f8e
06/12/13 21:43:38: prCallback: Medium Error on pd=04, StartLba=c3e94f7b, ErrLba=c3e94f8e
06/12/13 21:43:38: prRecQueue: starting pd=04 recovery - blocking host commands
06/12/13 21:43:38: prRecGo: Ready to attempt recovery errLBA=c3e94f8e on pd=04
06/12/13 21:43:38: prRecGo: dataErr found on ld=1, span=0, physArm=2, logArm=1, row=187d29f, strip=49777de, startRef=e,type=0
06/12/13 21:43:38: prRecGo: data NOT valid in cache
06/12/13 21:43:38: Issuing write verify pd=04 physArm=2 span=0 startBlk=c3e94f8e numBlks=1
06/12/13 21:43:38: EVT#36802-06/12/13 21:43:38: 110=Corrected medium error during recovery on PD 04(e0x20/s4) at c3e94f8e
06/12/13 21:43:38: EVT#36803-06/12/13 21:43:38: 93=Patrol Read corrected medium error on PD 04(e0x20/s4) at c3e94f8e
This indicates that Disk 4 (PD4) is on its way out and should be replaced ASAP.
Note Disk 4 is probably Disk 4 as installed in the server – not necessarily disk 4 in that raid array – so take care – and remember the first dis is Disk 0