The National Parks and Wildlife Service in Ireland recognised that the past application of statuses such as "rare" and "scarce" to invertebrates in Ireland had been inconsistent. They therefore commissioned Exegesis and Adam Mantell of Arctia Ecology to develop a more consistent approach to determining the rarity of Irish non-marine invertebrates. As this assessment only considered rarity, it was different from the IUCN red list process, which also considers the threats to species' survival. It was also recognised that expert review of these statuses is necessary, due to the presence of cryptic or otherwise under-recorded species that may not be as rare as the data suggests.
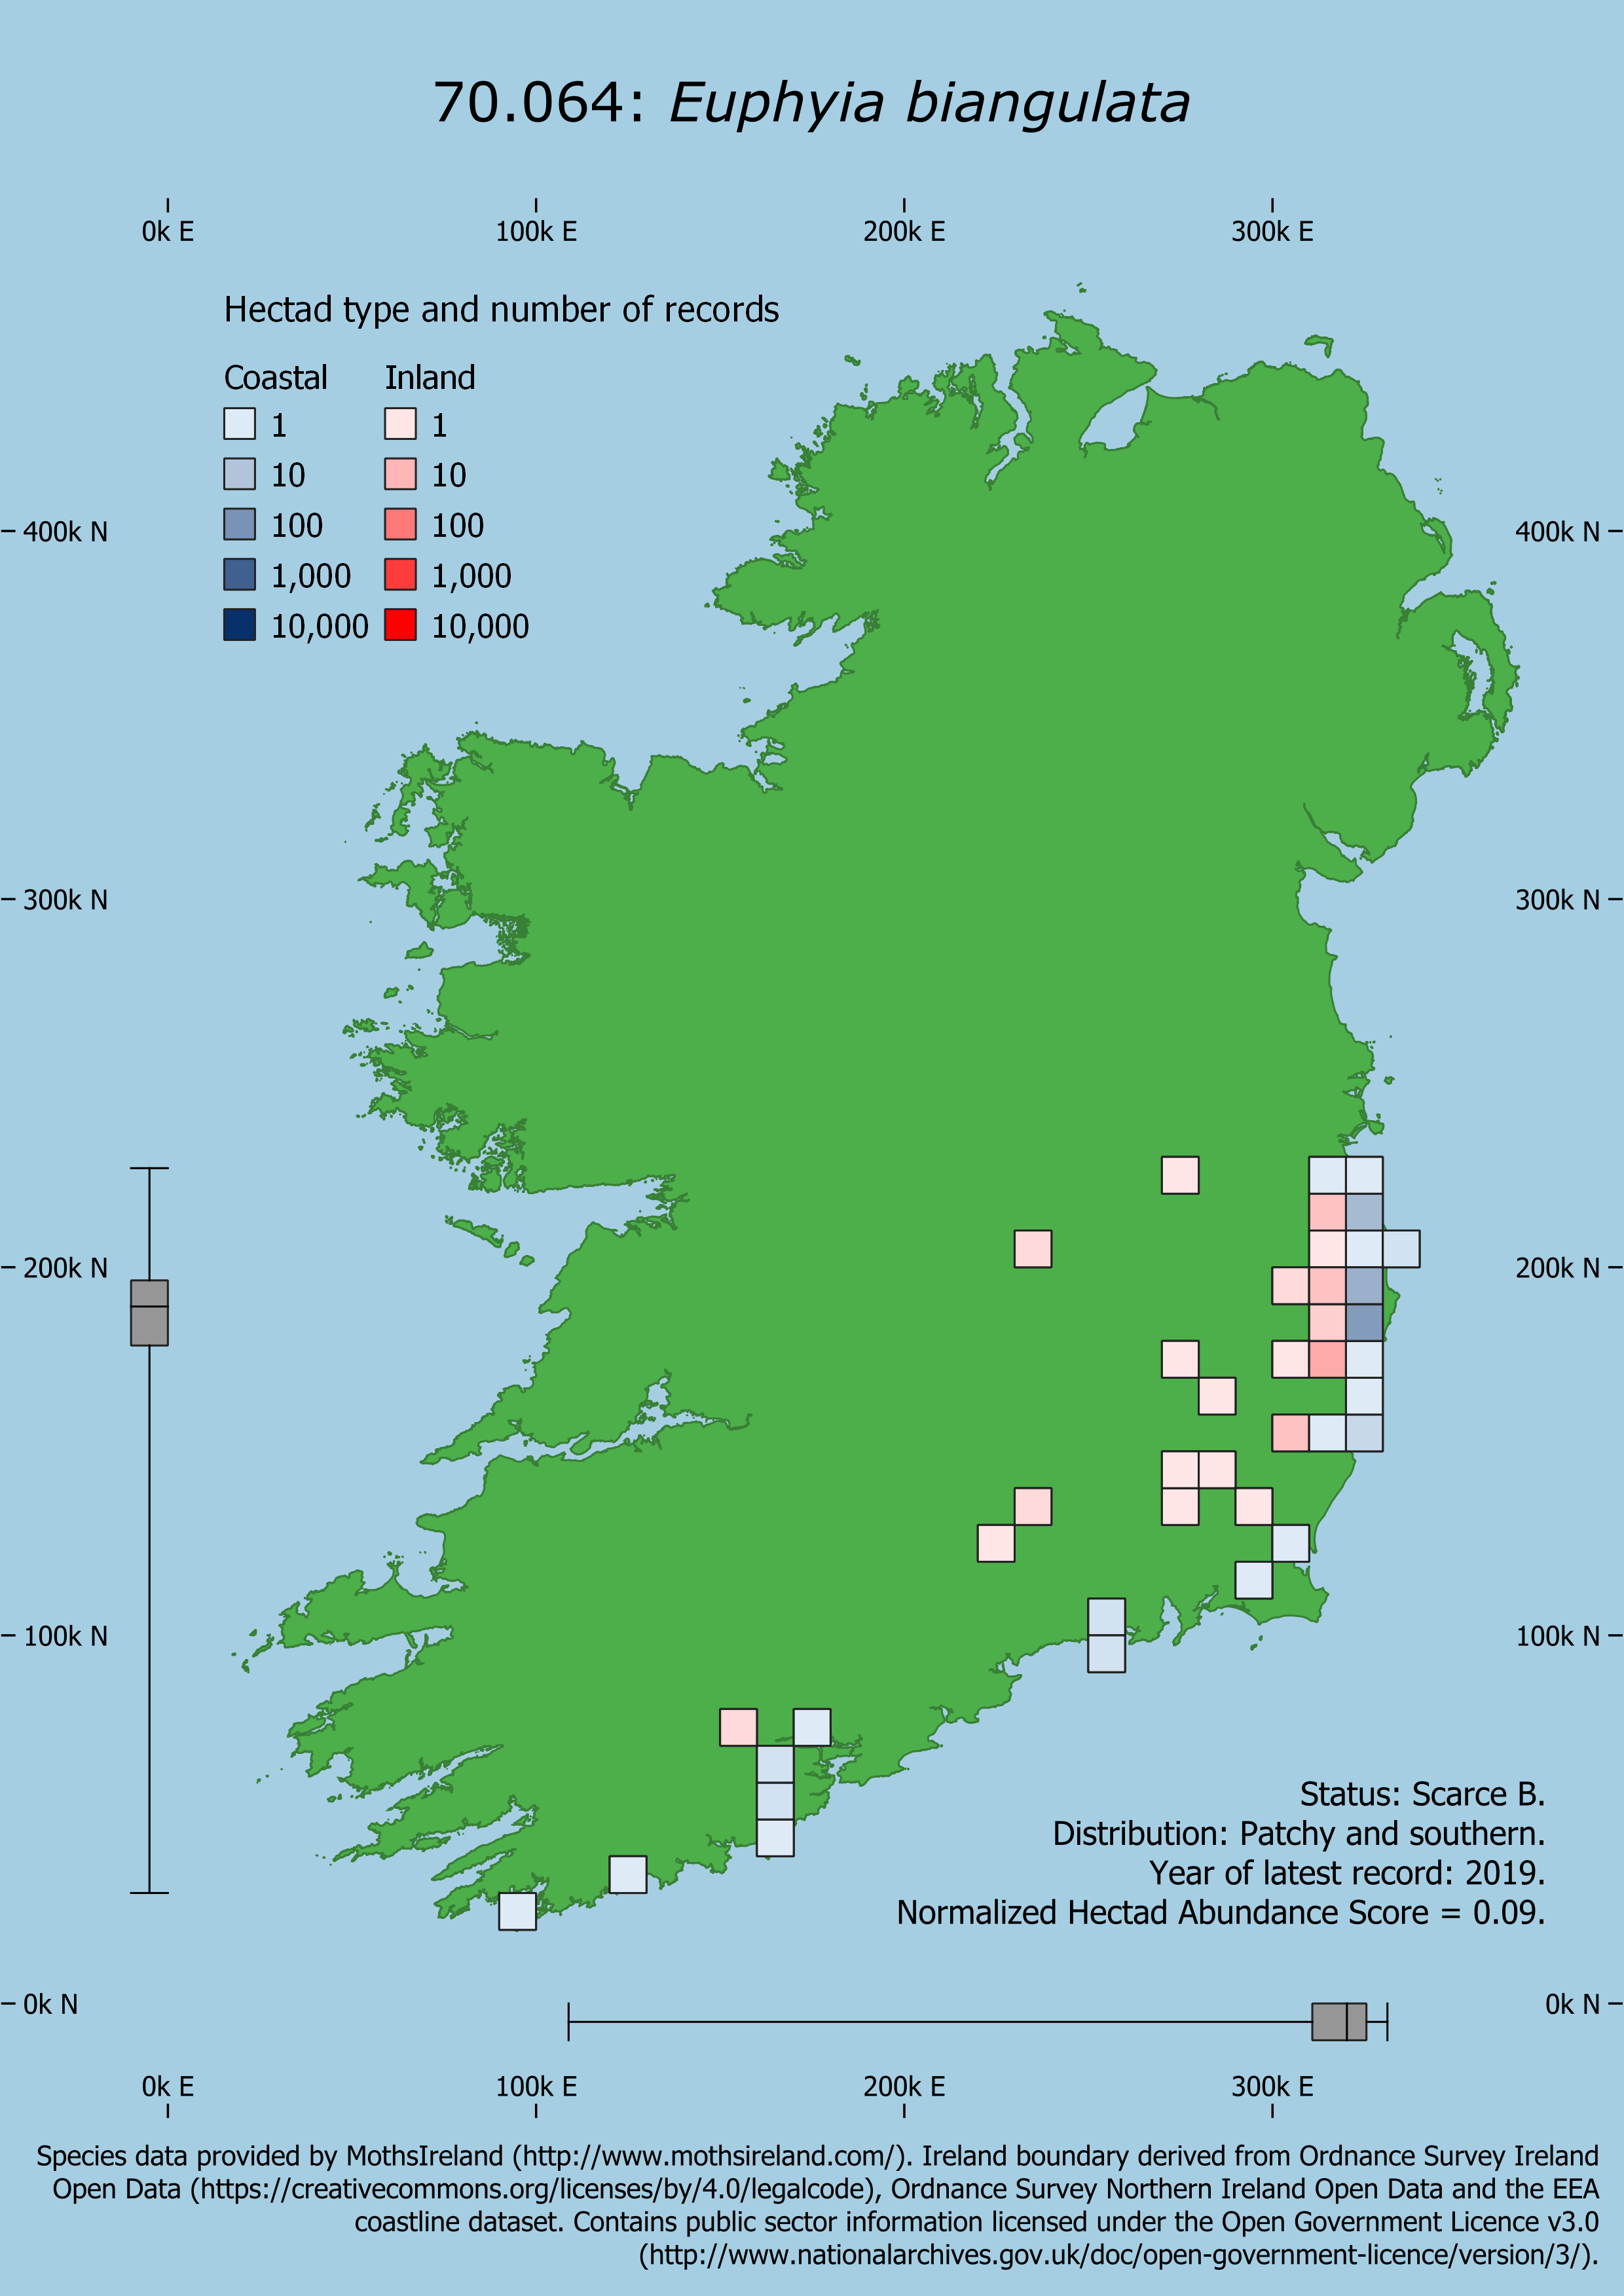 Distribution and status of the Cloaked Carpet Euphyia biangulata in Ireland. Data from www.mothsireland.com.
Following a review of approaches used in Ireland and other countries, it was clear that the approach should consider the number of occupied hectads (10 km × 10 km squares). Following discussion with other experts, we set the following thresholds:
- Rare species occur in 10 hectads or fewer. 10 hectads equates to about 1% of the land area of Ireland.
- Scarce species occur in between 11 and 50 hectads. 50 hectads equates to about 6% of the land area of Ireland.
We tested these on existing datasets for macro-moths and water beetles. We developed a set of PostgreSQL/PostGIS views that consistently processed and analysed these raw biodiversity datasets. We also generated standardised distribution maps for all 861 insect species through a novel use of atlas functionality in QGIS.
We also pushed the process further to provide additional insights into the distribution of each species. This included:
- Distinguishing coastal species, defined as species where 75% of occupied hectads were within 1 km of the coastline. To aid interpretation, inland and coastal hectads were shaded differently on the maps.
- Identifying geographic skew in species distributions, calculated using the spatial distribution of the underlying records. This skew was presented on each map as standard box-and-whisker plots, and using cardinal and intercardinal compass directions (e.g. north-eastern).
- Recognising species that had a patchy distribution using a DBSCAN cluster analysis algorithm. This helped to identify species that had no clear geographic skew but were nonetheless geographically restricted.
We also considered whether it was possible to assess the abundance of a species in the hectads from which it was recorded. This needed to overcome the effect of variable recording effort, which means that abundances in different datasets are not comparable. We therefore developed a Normalized Hectad Abundance Score, which scored the abundance of each species from 0 (lowest abundance, which is usually an average of 1 record per hectad) to 1 (the species with the highest average number of records per hectad) within each dataset.
All this information was clearly included on the maps, to facilitate the expert review of the results.
Further information from Crispin Flower.