Deer are large animals that are a potential hazard to vehicles on the road. Each year in the UK alone, it is thought that over 700 people suffer injuries or fatalities and over £17 million is spent on vehicle repairs because of Deer Vehicle Collisions (DVCs). In Scotland, a combination of increasing deer populations, especially in the central belt, and a growth in traffic has led to an increase in DVCs.
Exegesis was awarded a contract to collect and analyse data on Deer Vehicle Collisions (DVCs) in Scotland between 2019 and 2021. This work involved obtaining DVC records from a variety of sources in the public, private and third sectors, collating it into a consistent database, and analysing the data to identify trends and highlight areas of concern. This continued work undertaken since 2008 that had established data collation, processing and analysis protocols.
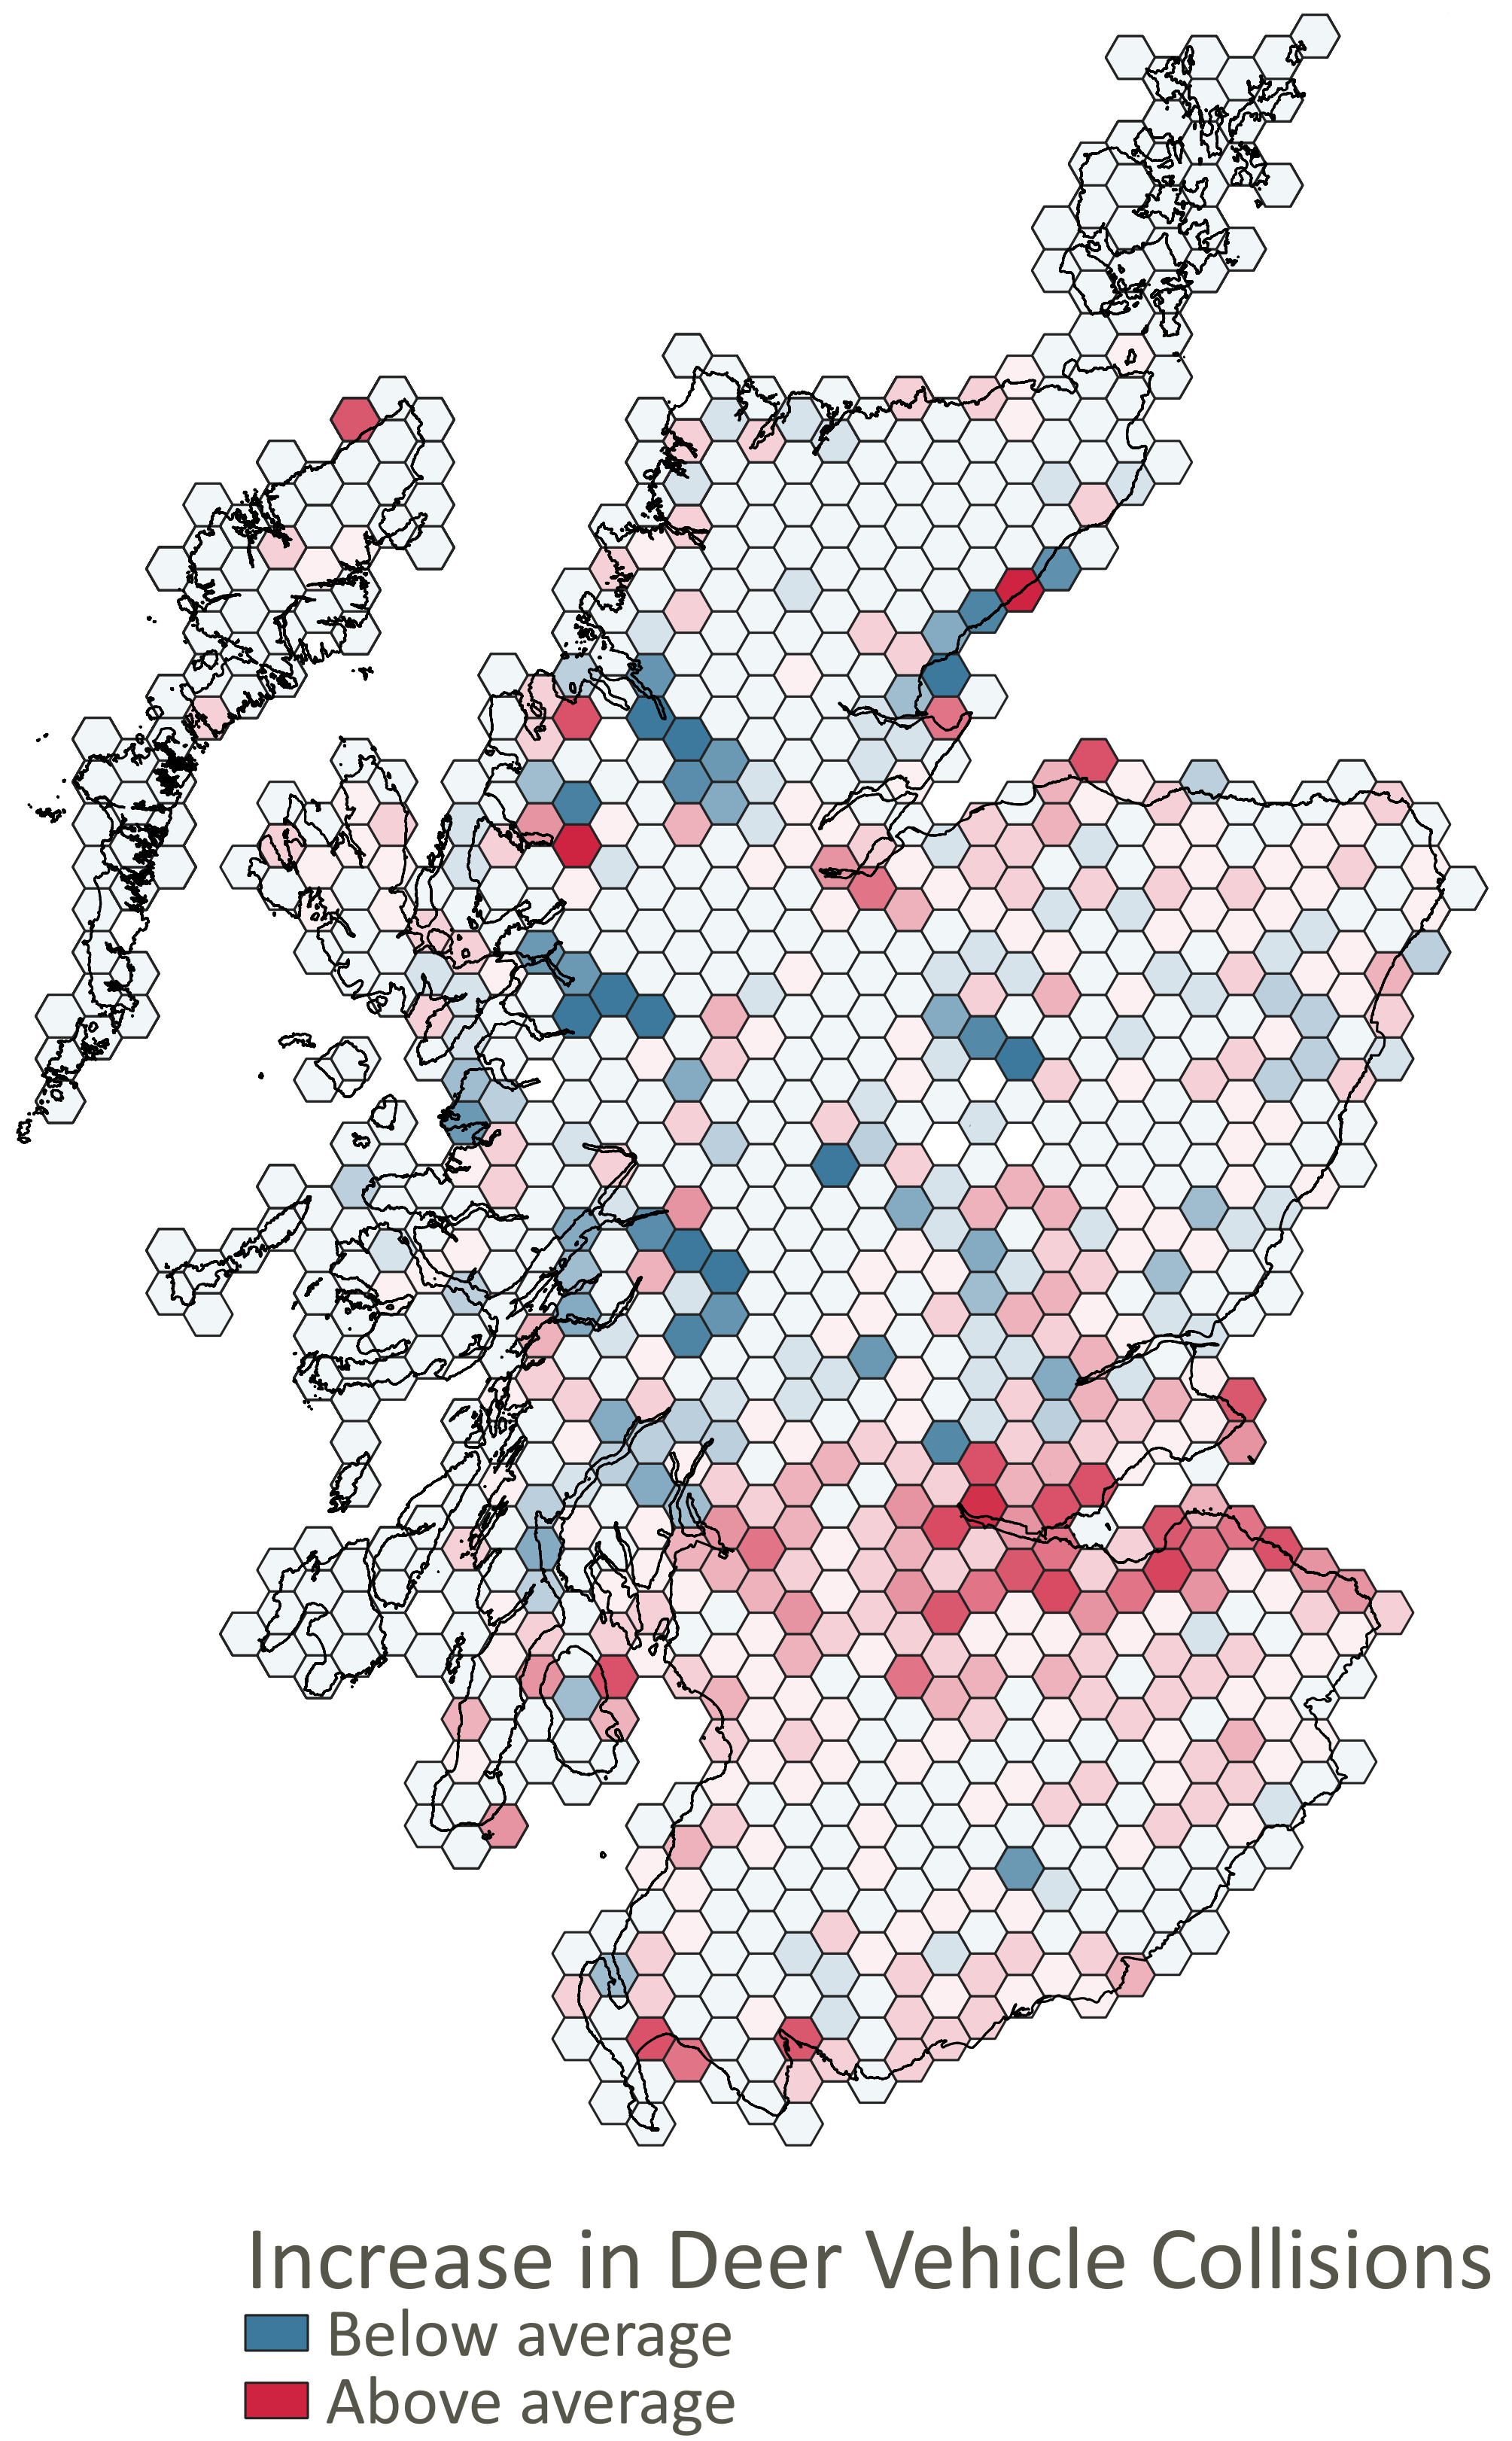 Change in the average number of DVCs per kilometre of road per year between 2008 to 2017 and 2018 to 2021. © Crown copyright (and database rights) 2022.
We added 5,479 records of DVC incidents in Scotland, bringing the total in the database for 2008 to 2021 up to 22,753 records. These were analysed in detail and a full report produced. Key findings included:
- Whilst there has been no recent significant increase in DVCs in Scotland overall, there has been a general increase in the central belt that has been offset by a decrease in northern Scotland (see map).
- Dusk is the worst time for DVCs, especially in May and June when overall numbers of DVCs are higher. This information can be used to target mitigation activities.
- There was no evidence of a decrease in DVC incidents resulting from travel restrictions introduced due to the Covid-19 pandemic (shown below). This contradicts claims of an anthropause where human impacts on wildlife were reduced. Nevertheless, the number of DVCs reported by members of the public, who would have been affected by the restrictions, were clearly suppressed. This suggests that freight traffic, which was largely unaffected by travel restrictions, was the cause of many DVCs during this time.
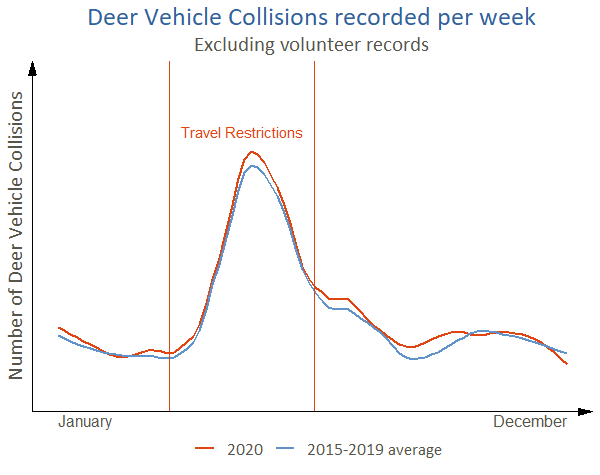 DVC frequency per week in 2020 and the average DVC frequency per week from 2015 to 2019. The start and end of the period where travel restrictions were enforced in 2020 due to the Covid-19 pandemic is shown as vertical red lines.
We also developed a new approach to analysing DVC risk on sections of the trunk road network, by using a moving window algorithm to identify the parts of roads with the most DVCs. We identified the blackspots with the highest DVC risk from the results. Most of these proved to be junctions surrounded by woodland in the more urban central belt. We recommended actions to mitigate the risk at the 10 worst blackspots.
The report has been published by NatureScot. We also produced a short non-technical summary of the key results.
Further information from Richard Griffiths.