In my previous post I got started with Multi-Mechanize and established that it is a useful tool for load-testing web sites. Next I tried it on a real site that we are currently building – the new “Norfolk Heritage Explorer”. This is a mojoPortal site with exeGesIS plug-in components that fetch data from the “HBSMR Gateway” web service. This is the bit I wanted to test for performance under load.
I ran the test against a single page in the new site that loads a record from the web service, with a query on the record ID.
http://nhe.no-ip.org/glossary?uid=TNF2069
I didn’t mention in the previous post that you need to watch the “errors” figure. You can see this in the console during the test run, and also at the top of the results html. The first time I ran the test, I got a huge error rate – something like 5000 errors out of 6000 transactions. Therefore I lowered the number of threads to 4, ramping up over 100 seconds.
This time I got 474 errors out of 627 transactions, and an interesting pattern emerged:
transactions: 627
errors: 474
run time: 100 secs
rampup: 100 secs
test start: 2011-12-28 10:39:26
test finish: 2011-12-28 10:41:04
time-series interval: 10 secs
Timer Summary (secs)
| count | min | avg | 80pct | 90pct | 95pct | max | stdev |
| 623 | 0.170 | 0.473 | 1.022 | 1.300 | 1.580 | 3.174 | 0.521 |
Interval Details (secs)
| interval | count | rate | min | avg | 80pct | 90pct | 95pct | max | stdev |
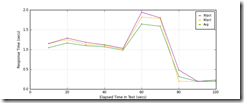
| 1 | 19 | 1.90 | 0.900 | 1.045 | 1.150 | 1.150 | 1.431 | 1.431 | 0.132 |
| 2 | 18 | 1.80 | 1.050 | 1.164 | 1.249 | 1.290 | 1.570 | 1.570 | 0.128 |
| 3 | 18 | 1.80 | 1.010 | 1.095 | 1.130 | 1.180 | 1.180 | 1.180 | 0.050 |
| 4 | 19 | 1.90 | 1.010 | 1.067 | 1.100 | 1.120 | 1.150 | 1.150 | 0.037 |
| 5 | 20 | 2.00 | 0.940 | 0.983 | 1.010 | 1.030 | 1.050 | 1.050 | 0.030 |
| 6 | 24 | 2.40 | 1.332 | 1.641 | 1.820 | 1.940 | 1.970 | 2.010 | 0.194 |
| 7 | 25 | 2.50 | 1.280 | 1.588 | 1.780 | 1.800 | 1.850 | 1.990 | 0.181 |
| 8 | 137 | 13.70 | 0.170 | 0.316 | 0.200 | 0.480 | 1.440 | 2.600 | 0.420 |
| 9 | 192 | 19.20 | 0.170 | 0.193 | 0.190 | 0.200 | 0.200 | 0.530 | 0.035 |
| 10 | 151 | 15.10 | 0.170 | 0.231 | 0.200 | 0.200 | 0.204 | 3.174 | 0.343 |
Graphs
Response Time: 10 sec time-series

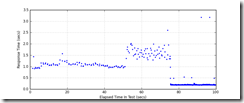
Response Time: raw data (all points)

Throughput: 10 sec time-series

I think what’s happening here is:
First 50 seconds we get consistent response times around 1 second with no errors. Not sure why no change at 20-30 seconds transition, because I would have expected M-M to add a virtual user at this point.
After 50 seconds, we clearly have more virtual users, and the site slows down with average responses 2.25 seconds.
At 75 seconds (presumably 3 virtual users), the response times become much faster… eh? Well because I was watching the console output I knew this is also when the errors starting happening – pity M-M’s analysis doesn’t reveal this. I also “manually” uses the site during this period, and found that mojoPortal was returning it’s standard “something’s bust” page (and doing so very rapidly!).
Examination of the mojoPortal system log showed that our plug-in component that talks to the web service was throwing an unhandled exception, along the lines that the root XML element was missing in the response from the HBSMR Gateway web service. This is turn was causing mojoPortal to output it’s standard error page.
2011-12-28 10:41:16,125 ERROR 82.31.27.48 - en-US - /glossary?uid=TNF2069 - mojoPortal.Web.Global - Referrer(none) useragent Mozilla/5.0 Compatible
System.Xml.XmlException: Root element is missing.
at System.Xml.XmlTextReaderImpl.Throw(Exception e)
at System.Xml.XmlTextReaderImpl.ParseDocumentContent()
at System.Xml.XmlTextReaderImpl.Read()
at System.Xml.XmlLoader.Load(XmlDocument doc, XmlReader reader, Boolean preserveWhitespace)
at System.Xml.XmlDocument.Load(XmlReader reader)
at System.Xml.XmlDocument.LoadXml(String xml)
at ESDMmojoPortal.NHE.Business.GatewayResult.get_BBox()
I’ll need to investigate this further, but it suggests the HBSMR Gateway web service was returning an error response or perhaps empty XML when put under this load. This has to be improved of course, because it can come under very heavy load when used from the national Heritage Gateway site as well as applications like the Norfolk Heritage Explorer.
So Multi-Mechanize has been incredibly useful in highlighting a weakness that could otherwise have rumbled on causing occasional problems for months.
However, note that at first glance the graphs look as though the site was performing better as the load increased, because erring transactions were included into the analysis undifferentiated. In this case it was extremely obvious this was not really the case, because once the page started giving errors it basically stopped working at all; but this could be far less clear-cur, and the verdict has to be to remember to look at the number of errors first, and if there are any then bear this in mind in any interpretation of the figures and graphs. It would be useful if M-M could represent the errors in the results analysis, perhaps including them into the tabular stats, and offering graphs with the errors filtered out.